
Property Taxes Just Went Up? We’ve Got You Covered!
It’s reassessment season for most folks in our area. Homeowners


Whenever we consider how strong, or weak, the real estate market is, it’s never good to only look at the last months’ sales and come up with an opinion. Sometimes, it’s helpful to look at the BIG picture. That’s what I’ve done here: I’ve taken a few of the more common factors when thinking about the real estate market, and compared the entire year of 2012 to 2013. In the chart below, I’ve listed everything from number of sales, to number foreclosures, to types of financing — and several items in between.
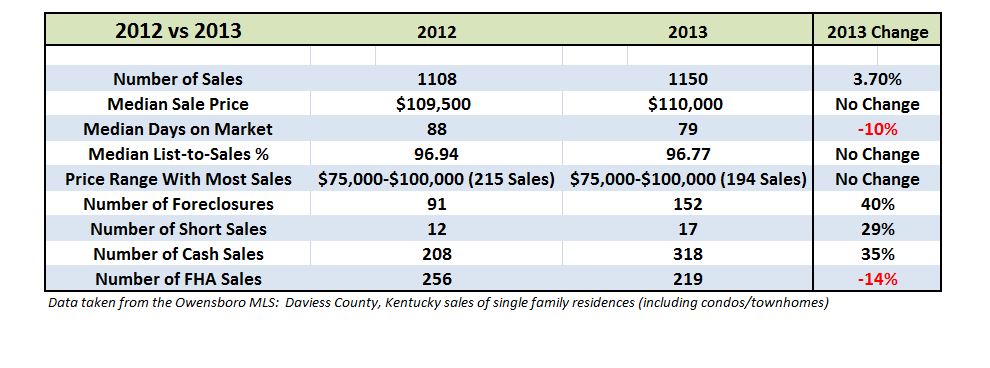
Let me briefly try to comment now, on these numbers. A few things changed very little: the number of sales only slightly went up (42 more sales in 2013); the median sale price has stayed almost constant; the median list-to-sales price ratio (how closely the home sells to its list price), and the price range with the largest number of sales, each saw little to no change. So, we can say with some degree of confidence, that the Daviess County area has seen about 1,100 annual sales (through the MLS) with a median sale price of $110,000, and the price range with the most number of sales for the past two years is between $75,000 and $100,000.
Enough with the easy stuff, though. Let’s move on to something more interesting! Days on market is a number everyone likes to look at, to see how quickly homes are selling. In 2012, homes spent a median 88 days on the market, or roughly three months. The year 2013 saw a respectable 10% decrease in the time it took to sell a home, which is a very good thing! We’re still close to three months, but below the 80-day mark. Way to go Realtors®!
Shifting our focus to foreclosures and short sales, it’s obvious that 2013 was a much bigger year for this type of transfer. That’s a good thing for investors – they saw 40% more foreclosure sales in 2013, and almost 30% more short sales. However, it’s not such a good thing for homeowners. While there aren’t many neighborhoods left where the entire market is defined by foreclosure or short sales, 15% of all the sales through the MLS were either foreclosures or short sales. Now that’s a big number. Here’s hoping that 2014 sees that number decreasing significantly.
Finally, it’s always important to consider financing. What does financing tell us about the local real estate market? It could tell us a lot…then again, it could just confuse us more! The number of FHA sales went down by 14%, while the number of cash transactions shot up by a whopping 35%. Conventional rates did go up, from an average of 3.66% on a 30-year conventional loan in 2012 to 3.98% a year later, but FHA rates actually went down from 3.97% to 3.53% (FHA data only available through May, 2013). Obviously, rates aren’t the only factor in mortgage financing. It seems to be getting harder & harder to get a home loan, no matter the type of financing. The fact that cash sales are up, and FHA sales are down more than proves that statement. I’m sure Dave Ramsey likes these numbers. What does he say? Cash is King? While I would agree that paying cash is best whenever possible, I’m also hoping that the number of home loans goes up this year! Not only for my friends in the mortgage lending profession, but also for my own business, as well as that of my fellow appraisers! Usually, if a purchaser of real estate buys with cash, they don’t get a home appraised…so you see why I’d like to see more people financing their homes!
However you interpret this data – the numbers don’t lie. The overall, big picture of Daviess County is that the real estate market is stable, although with more than its fair share of foreclosure sales. If you’d like to talk about the finer points of this data, give us a call!
It’s reassessment season for most folks in our area. Homeowners

I feel like we all need a laugh. How about
So this may be a slight break from the norm,