
Missed the Reassessment Window? Here’s What You Can Still Do
Missed the Reassessment Window? Here’s What You Can Still Do


Upon completing an appraisal assignment in the Landsdowne area of Owensboro, I noticed an interesting trend. I analyzed seventeen sales in the subdivision, all of which were listed for sale through the MLS and sold in the past twelve months (one sale was not considered as it was a short sale). After analyzing these sales, a direct correlation became glaringly obvious: a year ago, things looked a lot better than they do today.
We can see that as we move along throughout 2013, the number of sales in Landsdowne decrease, along with median sale prices. (You can click below to enlarge the image:)
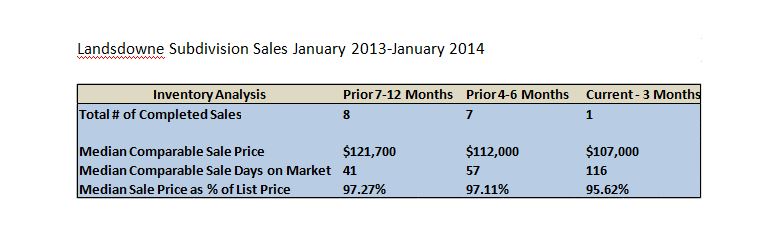
It would stand to reason that the longer a home sits on the market, the lower the sale price will be, and the spread between list price and sale price will be greater. Unfortunately, this is not always the case, or there just isn’t enough data to analyze. In this example, however, there is a direct correlation between how long a house sat on the market, and how much it sold for, relative to the list price.
In the first part of 2013, the eight homes which sold in Landsdowne spent a median 41 days on the market and sold for almost 97% of list price. However, as the year progressed, the days on market increased, while the sale price and list-sale price ratio decreased. In other words, the second half of 2013 saw homes staying on the market longer and selling for less.
What does all this mean? Well, for starters, it means that if you’re planning on selling your home in Landsdowne, you need a good real estate professional to help you price your home correctly. Give us a call at Riverfront Appraisals and we’ll help, because you don’t want to trust the pricing of your greatest investment to just anyone. If you have an appraisal question, or would like to have your home appraised, simply email us and we’ll be in touch.
Missed the Reassessment Window? Here’s What You Can Still Do

It’s reassessment season for most folks in our area. Homeowners
I feel like we all need a laugh. How about