
Property Taxes Just Went Up? We’ve Got You Covered!
It’s reassessment season for most folks in our area. Homeowners


It’s finally time for the 2019 Year In Review! It’s taken a bit longer for us to put everything together this year for a couple of reasons.
But first – a few quick disclaimers! All numbers presented here median values (sale price, DOM, etc). And, all data has been taken from the respective market’s MLS. Finally, the numbers you see and read here are county-wide. For specific market segments or neighborhoods, feel free to contact us and we’ll be happy to help!
Daviess County, Kentucky

2019 was a great year for Owensboro! Sales have been up consecutively over the past five years, but saw the greatest one-year jump in 2019, with an increase in 107 more sales over 2018. Homes sell for about 96%-97% of list price, and that hasn’t really changed much in the past five years. But the median sale price sure has! Since 2015, the median sale price of homes in Owensboro/Daviess County have increased 18%. And just in the past year, we’re up 5.2% county-wide. Those are great numbers. Days on market has dropped about 7 to 10 days in the past five years, and has stayed about the same over the past three years, with a median DOM of around two months (65 days on the market in 2019).
Henderson County, Kentucky
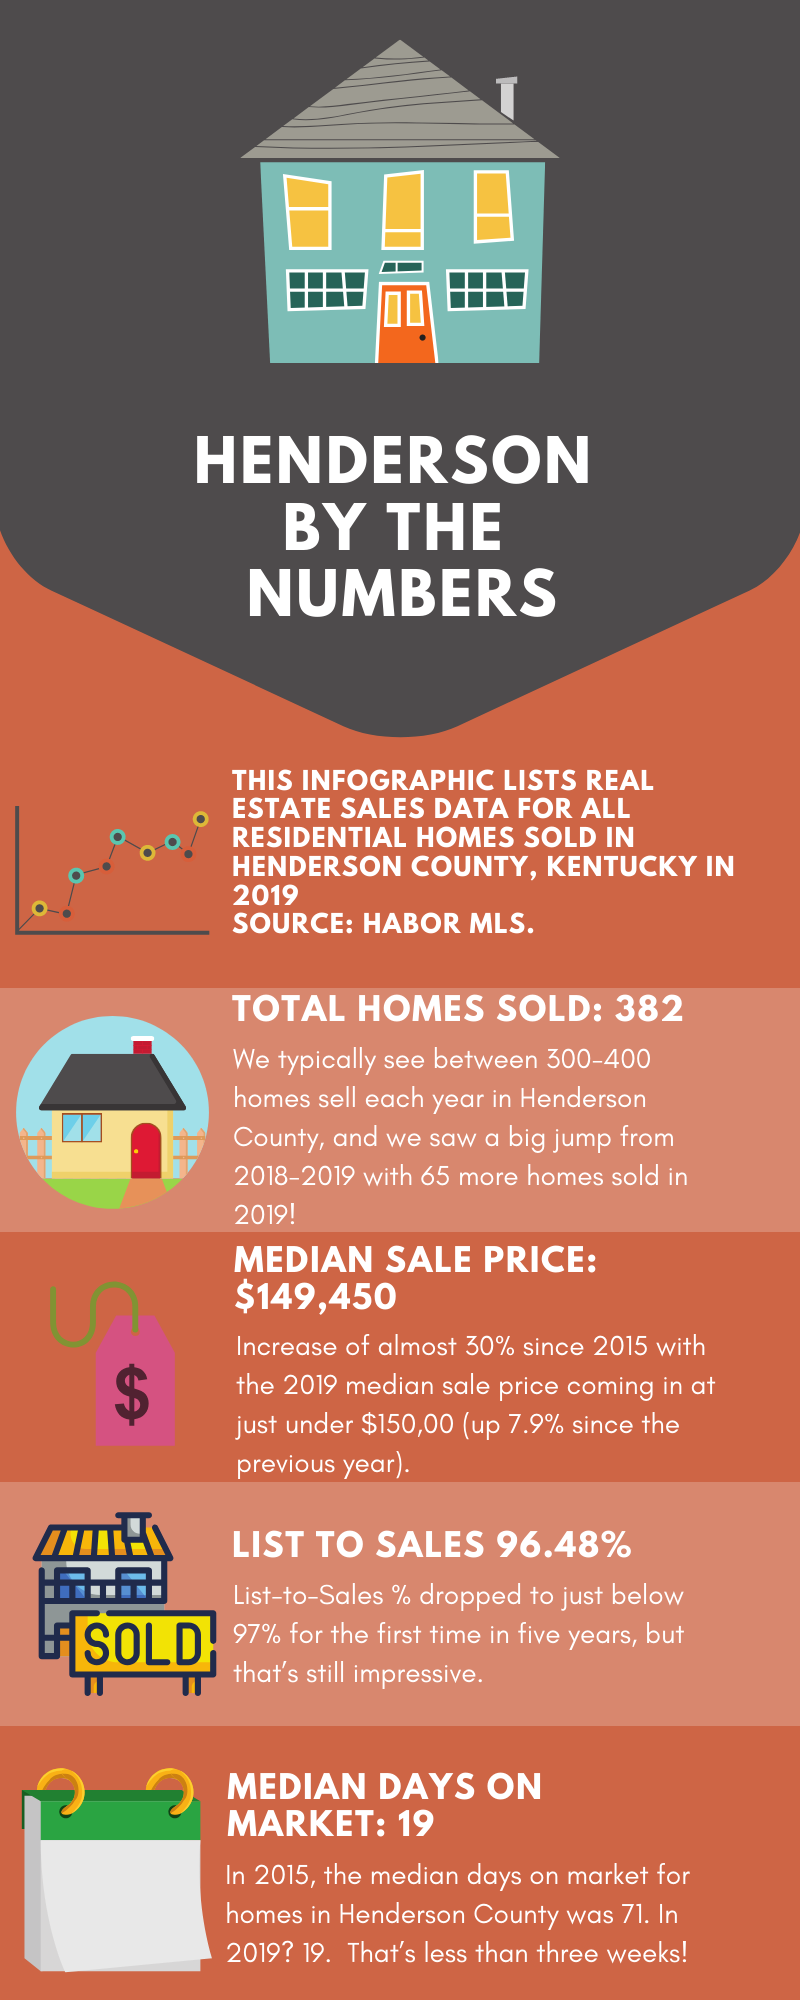
Home sales continue breaking records in Henderson County, and 2019 was no exception. We typically see between 300-400 homes sell each year in Henderson County, and we saw a big jump from 2018-2019 with 65 more homes sold in 2019! The bottom has just dropped out of days on market. In 2015, the median days on market for homes in Henderson County was 71. In 2019? How about 19. That’s less than three weeks! List-to-Sales % dropped to just below 97% for the first time in five years, but that’s still impressive. Median sale prices have increased almost 30% since 2015 with the 2019 median sale price coming in at just under $150,00 (up 7.9% since the previous year).
Perry County, Indiana
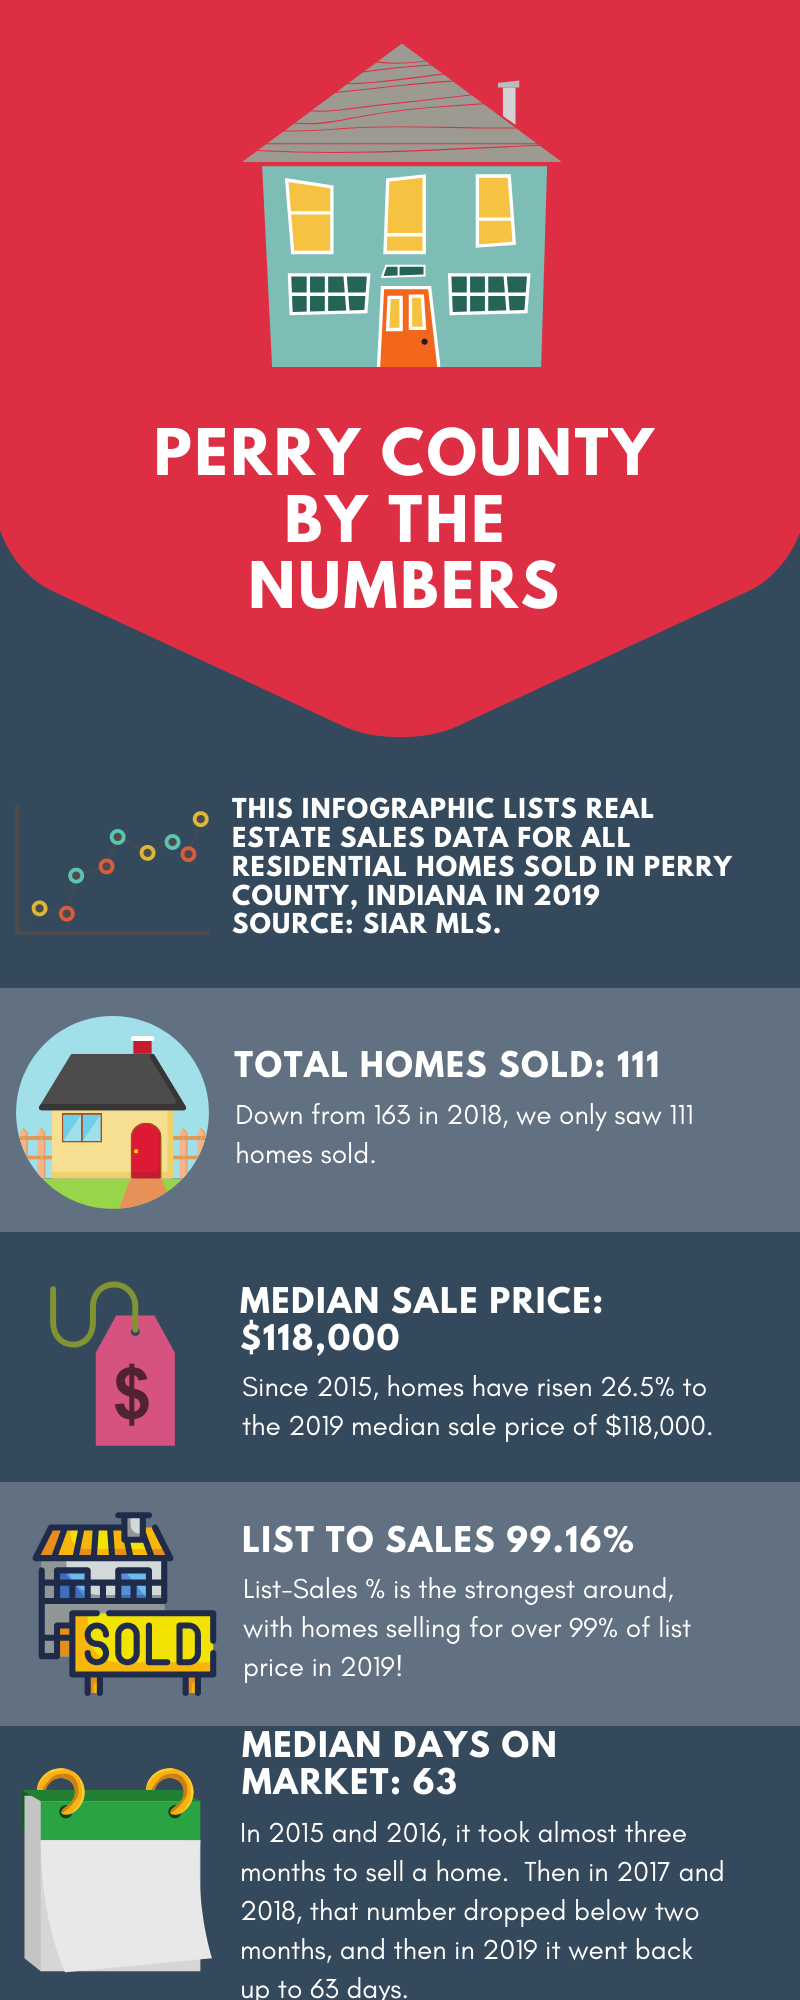
2019 was a tough year for the number of Perry County home sales. Down from 163 in 2018, we only saw 111 homes sold. But, as one might expect, the sale prices were up. Since 2015, homes have risen 26.5% to the 2019 median sale price of $118,000. Days on market has been on a bit of a roller coaster ride. In 2015 and 2016, it took almost three months to sell a home. Then in 2017 and 2018, that number dropped below two months, and then in 2019, it went back up to 63 days. List-Sales % is the strongest around, with homes selling for over 99% of list price in 2019! This indicates that there is a shortage of available homes and that Realtors are pricing homes well in Perry County!
Spencer County, Indiana
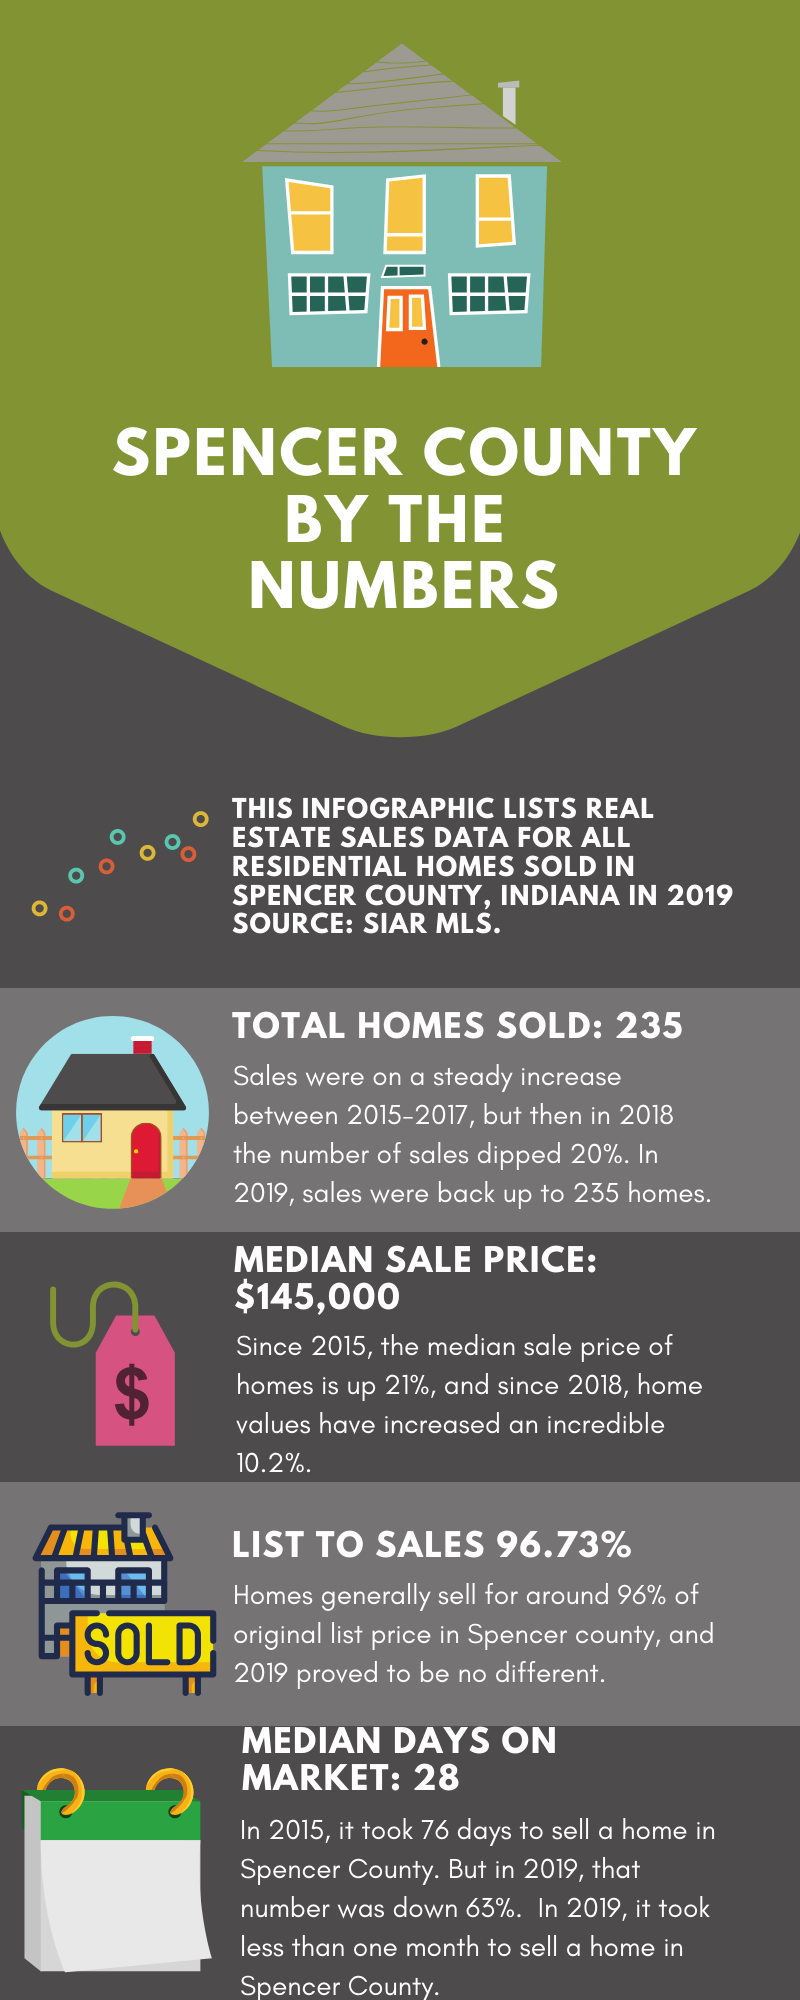
Just like days on market has seen swings in Perry County, the number of homes sold has been on a five-year ride in Spencer County. Sales were on a steady increase between 2015-2017, but then in 2018, the number of sales dipped 20%. In 2019, sales were back up to 2017 levels in terms of the number of homes sold at 235 homes, just 10 homes shy of the five-year high in 2017. Homes generally sell for around 96% of original list price in Spencer county, and 2019 proved to be no different. Days on market has dropped steadily since 2015. In 2015, it took 76 days to sell a home in Spencer County. But in 2019, that number was down 63%. In 2019, it took less than one month to sell a home in Spencer County. And finally, sales have risen each year in the last five years. Since 2015, the median sale price of homes is up 21%, and since 2018, home values have increased an incredible 10.2%.
Warrick County, Indiana
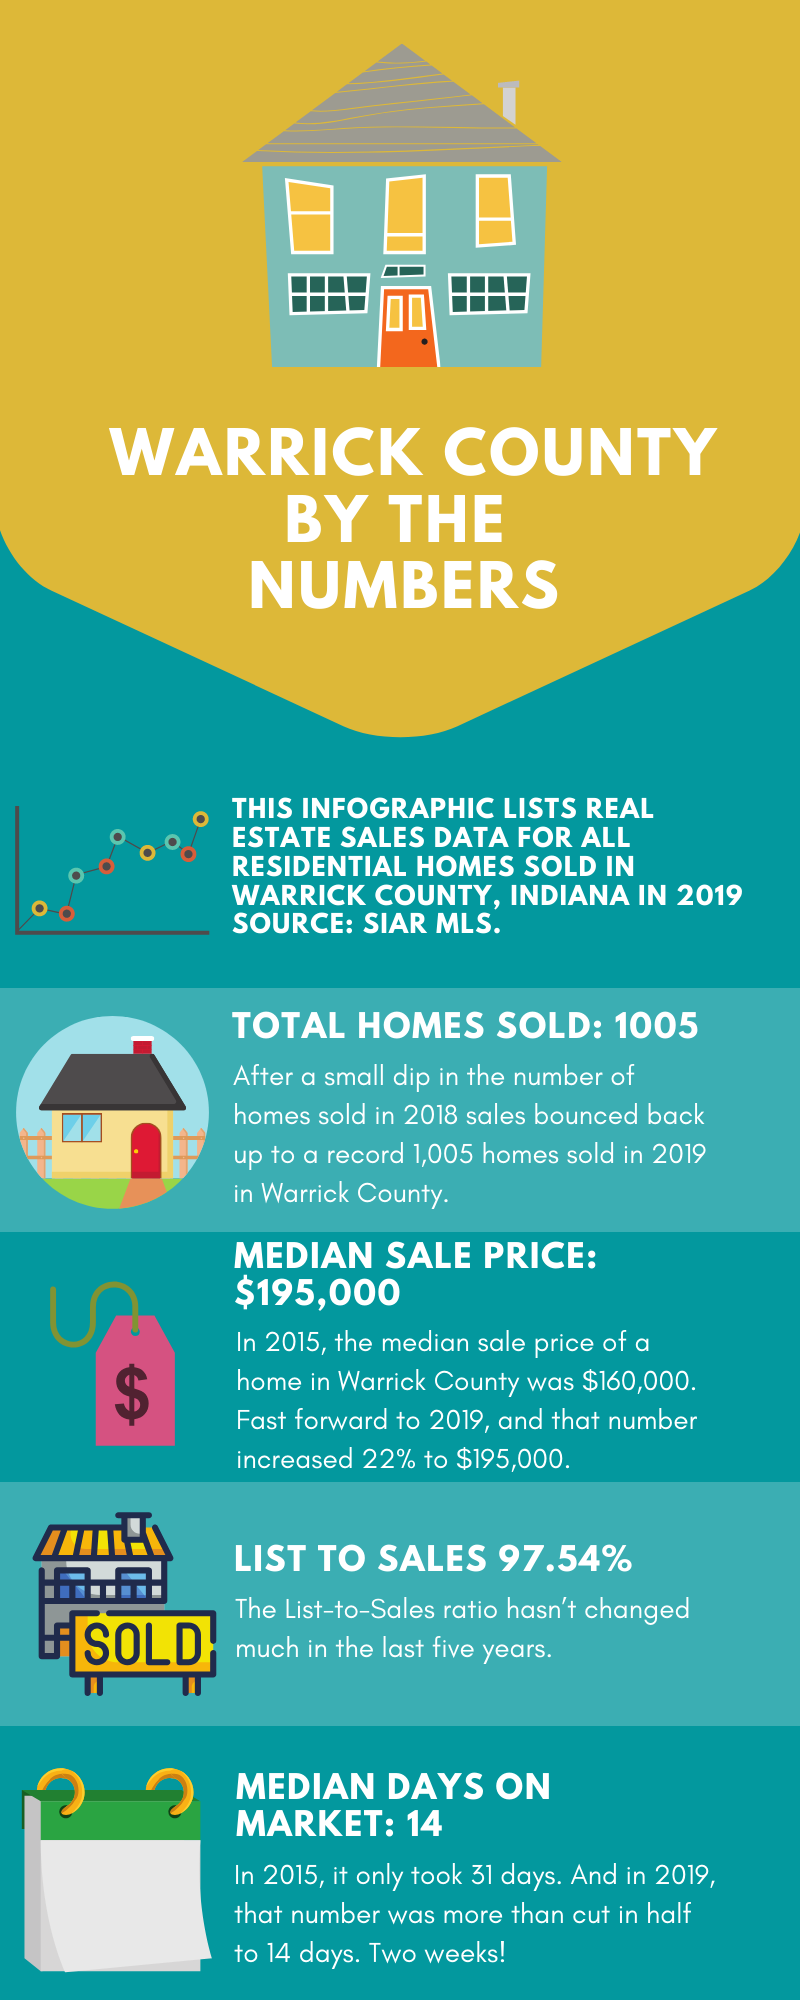
After a small dip in the number of homes sold in 2018 (950 homes down from 971 the previous year), sales bounced back up to a record 1,005 homes sold in 2019 in Warrick County. The List-to-Sales ratio hasn’t changed much in the last five years, as homes typically sell for around 97% – 98% of their original list price. What is most impressive, though, is how long it takes to sell a home in Warrick County. In 2015, it only took 31 days. And in 2019, that number was more than cut in half to 14 days. Two weeks! That’s incredible! And, as one would expect (and hope), the median sale price of homes has increased each year over the past five years. In 2015, the median sale price of a home in Warrick County was $160,000. Fast forward to 2019, and that number increased 22% to $195,000. And, sales were up 3.7% in the last 12 months. Not a huge increase, but hey – increasing market values are better than decreasing any day!
If you can’t tell, we like to geek out on numbers. And, we’d be happy to geek out just for you! If you have a question about a particular market or neighborhood or need an appraisal on your home, give us a call. We’d love to help!
Helping homeowners navigate the appraisal process,
Ryan Bays, SRA, AI-RRS
It’s reassessment season for most folks in our area. Homeowners

I feel like we all need a laugh. How about

So this may be a slight break from the norm,